Fairmont Gold Pieces, Part IX: The Carson City Coins
/a guest blog by Richard Radick
Introduction: The Fairmont Collection and its Parent Population
As of February, 2025, the Fairmont Collection comprises almost 8,300 US gold coins, graded by the Professional Coin Grading Service (PCGS) and bearing “The Fairmont Collection” pedigree on their holders. These coins have been marketed primarily by Stack’s Bowers Galleries (SBG) in a series of auctions between June, 2018, and February, 2025. I will refer to them as the “pedigreed” Fairmont coins. By searching SBG auction records, the PCGS “Cert Verification” database, plus several dealer inventories, I have built a database for the pedigreed Fairmont coins that I believe to be more-or-less complete.
Despite the word “collection,” the Fairmont Collection is not a purpose-built collection in the usual sense of the word – rather, it is part of a hoard. It is now evident that the Fairmont Collection, as defined above, is only about 2% of a much larger parent population of perhaps 400,000 coins, encompassing the best coins from this parent population in terms of both rarity and condition. The vast majority of the coins in this parent population - probably about 90% - have been graded by PCGS without the Fairmont pedigree on their holders. I will, accordingly, refer to them as the “non-pedigreed” Fairmont coins. My database includes some, but by no means all, of these non-pedigreed coins
I have developed a method for estimating the total number of PCGS-graded Fairmont coins (i.e., pedigreed + non-pedigreed, combined) for any date/mint variety by analyzing time series, which I have constructed from historical records of the PCGS Population Report (Pop Report) database. These time series track the cumulative counts of US gold coins graded by PCGS for every date/mint variety, starting in late 2017 and ending at the current time, with a two-month cadence.
This procedure allows me to estimate numbers for the relatively common varieties of gold coins in the Fairmont hoard, such as the 1891-CC eagles, without reference to the database. Some of these common varieties are represented by hundreds, or even thousands, of coins in the Fairmont hoard, among which the pedigreed Fairmonts typically number no more than 20-30 coins.
It also seems likely that perhaps 5% - 10% of the coins from the Fairmont parent population have never been submitted to PCGS for grading, presumably because they are badly worn or damaged, and were therefore deemed not worth the expense. I will refer to these shadowy coins as the “ungraded” Fairmonts.
Gold coins from the Carson City mint make up relatively small fractions of both the pedigreed and the non-pedigreed Fairmont coin populations. As of February, 2025, 857 (about 10.4%) of the known pedigreed Fairmont coins are from Carson City, and some 3,600 additional Carson City coins (comprising perhaps 0.9% of the parent population) exist among the non-pedigreed Fairmonts.
In this article, we will explore in detail the population and condition demographics of the Carson City Fairmonts. We will then consider the Carson City Fairmonts within the broader context of Carson City gold coinage in an analysis of survival rates, and end with a brief summary and discussion.
For the most part, in this article I will not repeat in detail material that has appeared previously in this series. For example, considerably more information about the construction and analysis of the time series may be found in the sixth article of this series.

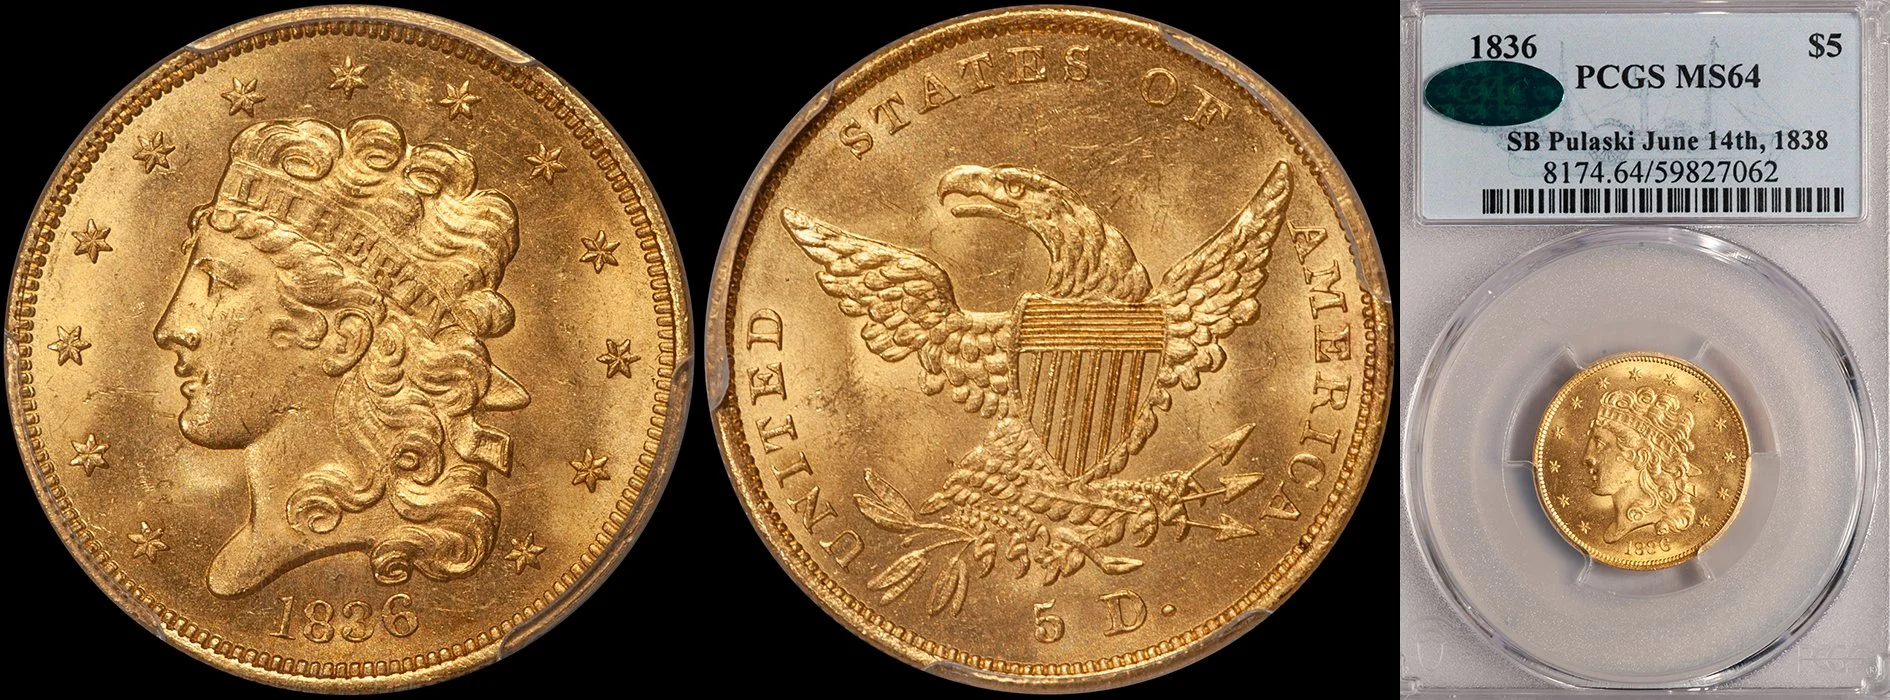
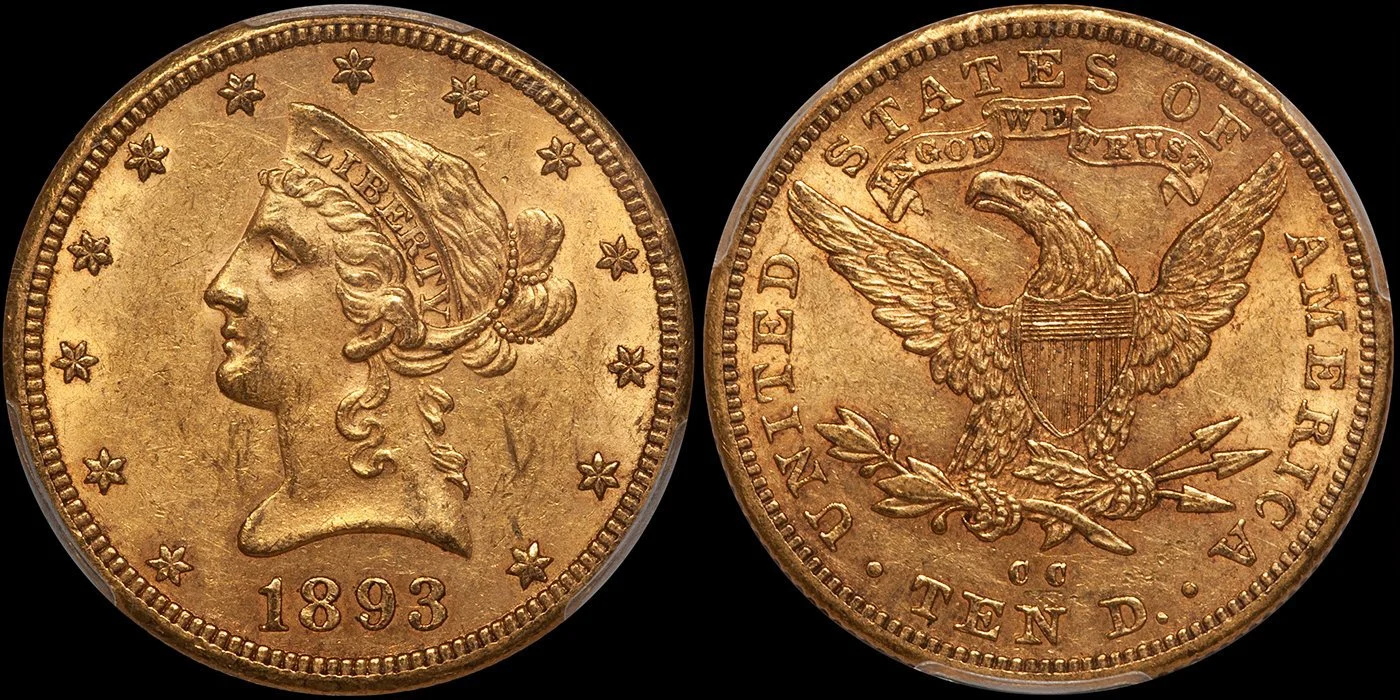
1873-CC $5.00 PCGS VF30 CAC, ex Fairmont, from the DWN Archives
Number and Condition Demographics for the Fairmont Carson City Gold Coins
A summary of the number and condition demographics for the Fairmont Carson City $5, $10, and $20 coins is presented in this section as a series of three table, one for each denomination.
In each table, the number demographics are displayed in a block of four columns. The first column in this block (“Ped”) lists the number of pedigreed coins, according to my database, and the second column (“Count”) list the total number - i.e., pedigreed + non-pedigreed, combined. The only issues for which these two numbers differ are the 1891-CC half eagle (1 coin), the 1881-CC eagle (26 coins), and the 1878-CC double eagle (6 coins); this situation is peculiar to the Carson City Fairmonts, because my database includes only a handful of non-pedigreed Fairmonts from Carson City. I have tabulated both numbers mainly to preserve consistency.
The third column (“TS+Imp”) lists the estimates derived from the time series. These time series are based on the PCGS Pop Reports, which do not include impaired coins - i.e., coins with PCGS-Details grades. Accordingly, I have modified the estimates to include the known numbers of impaired coins. This correction is also largely a formality - I know of only 16 impaired coins among the Carson City Fairmonts.
Therefore, for each issue, I have two numbers: a database count (“Count”), and a modified estimate derived from the time series (“TS+Imp”). The desired quantity, the number of coins likely to be in the Fairmont hoard (which I will designate “F-Total”), will be either “Count” or “TS+Imp” - the trick is to decide which.
The selection procedure I have devised is a three-step decision process, which can be described in semi-mathematical terms as follows:
(Step #1): If (Count TS+Imp), choose F-Total = Count
(i.e., choose the database count if it is likely to be complete, which it plausibly is when it is larger than the time series estimate).
(Step #2): Otherwise, if (TS+Imp 20), choose F-Total = TS+Imp
(i.e., this is probably a “common” variety, for which the count from my database is likely to be incomplete. The dividing line between “common” and “scarce” is here assumed to be 20, but it could be set to another value.).
(Step #3): Otherwise, choose F-Total = Count
(i.e., this is probably a “scarce” variety, for which the database count is likely to be complete).
The fourth column in the block (“F-Total”) lists the selected values. I have highlighted in yellow entries for “F-Total” where the modified time series estimate “TS+Imp” was selected, rather than the “Count.” For readers who wish to cut to the chase, this column lists the number of coins for each Carson City issue that I believe are in the Fairmont hoard.
The condition demographics are displayed in the remaining columns, along with a column that lists the number of coins for each issue with Certified Acceptance Corporation (CAC) stickers.
For each issue, the number of coins with known PCGS-numerical grades (primarily pedigreed coins) is listed in the “Graded” column, and the number of impaired coins with PCGS-Details grades is in the “Details” column.
The column headed “WAG” contains the weighted average numerical grades for the coins in its row, and provides a handy numerical way to intercompare groups objectively. For example, for the 1872-CC half eagles, the WAG for the nine coins with known numerical grades is 37.0 - i.e., between VF-35 and XF-40 (there is, of course, no such thing as a “VF-37” coin). Among these nine coins, the highest grade is AU-58.
The “Totals” row at the bottom of the table for each denomination contains summary data for the entire number of Fairmont Carson City coins presently known. For the half eagles, there are 250 Carson City Fairmonts with numerical grades, and the WAG for these coins is 52.9.
Below the “Totals” line are two lines containing PCGS data. The very bottom line describes the entire universe of Carson City gold coins that have been graded by PCGS as of late December, 2024. The line above it (“Scaled PCGS”) contains the same data, scaled to represent the PCGS distribution as it would appear for an ensemble of coins equal to the number of Fairmont Carson City coins with numerical grades. The weighted average grade (WAG) for all PCGS-graded Carson City half eagles is 50.1, a bit lower than the WAG for the Fairmont coins. Inspection of the grades on the right side of the table shows that this difference arises primarily from relatively more mint-state coins among the Fairmont Carson City half eagles.


Two Carson City issues are missing from the Fairmont Collection - the 1871-CC & 1873-CC eagles, and four others are represented by single examples - the 1870-CC half eagle, the 1870-CC & 1879-CC eagles, and the 1870-CC double eagle. With the possible exception of the 1871-CC eagle, these are all notable rarities, and, as will be shown in the following section, these incidence numbers are not too surprising, albeit perhaps a bit low.
On the other end of the rarity spectrum, the most abundant Fairmont Carson City issues are the high-mintage issues. The most numerous issue is the 1891-CC half eagle, with an estimated 736 examples in the Fairmont hoard. In second place is the 1891-CC eagle, with 575. The 1890-CC half eagle and the 1876-CC, 1884-CC, & 1890-CC double eagles round out the roster of issues with more than 200 coins - the 1892-CC half eagle and the 1875-CC double eagle just miss the cut.
There are no gem-grade (i.e., MS-65 or higher) Carson City Fairmonts: the finest known are four 1890-CC & four 1891-CC half eagles graded MS-64, one 1891-CC eagle also graded MS-64, and seven double eagles graded MS-63 - 1882-CC (1), 1883-CC (4), 1884-CC (1), & 1885-CC (1). This is, in fact, consistent with the broader pattern - gems seem to be relatively uncommon within the entire Fairmont hoard.
I will conclude this section with a graphical visualization of the issue-by-issue condition of the Fairmont Carson City coins, as measured by their weighted average grades (WAGs). This information is, of course, presented in numerical form in the preceding tables, but a visual recapitulation better emphasizes the overall pattern. The figure below presents the data.

There is nothing very surprising about this distribution, which is reassuring. The trend for the half eagles and the eagles rises fairly smoothly from left to right, with only one prominent outlier, the 1870-CC eagle, which is a single low-grade (G-6) coin. The distribution for the double eagles is flatter, which reflects the relatively higher and narrower condition range for these coins: there are only two Fairmont Carson City $20s graded below XF-40.
A plot of average grades (i.e., the WAGs), however, misses an important point, namely, the condition that might be expected for any particular variety. Thus, it is also informative to consider departures from expected condition. The following figure does this.
I have plotted a quantity that I call the Condition Index, which is the difference between the WAGs for the Fairmont coins and the corresponding WAGs for their counterparts in the PCGS Population Reports. The WAGs measure the “centers of gravity” for the Fairmont and the PCGS grade distributions, so their difference compares the centroids of the two distributions. A positive Condition Index implies that a group of Fairmont coins is (on average) higher in grade than the corresponding coins of the PCGS Population Reports, and negative differentials imply a lower average numerical grade for the Fairmont coins.
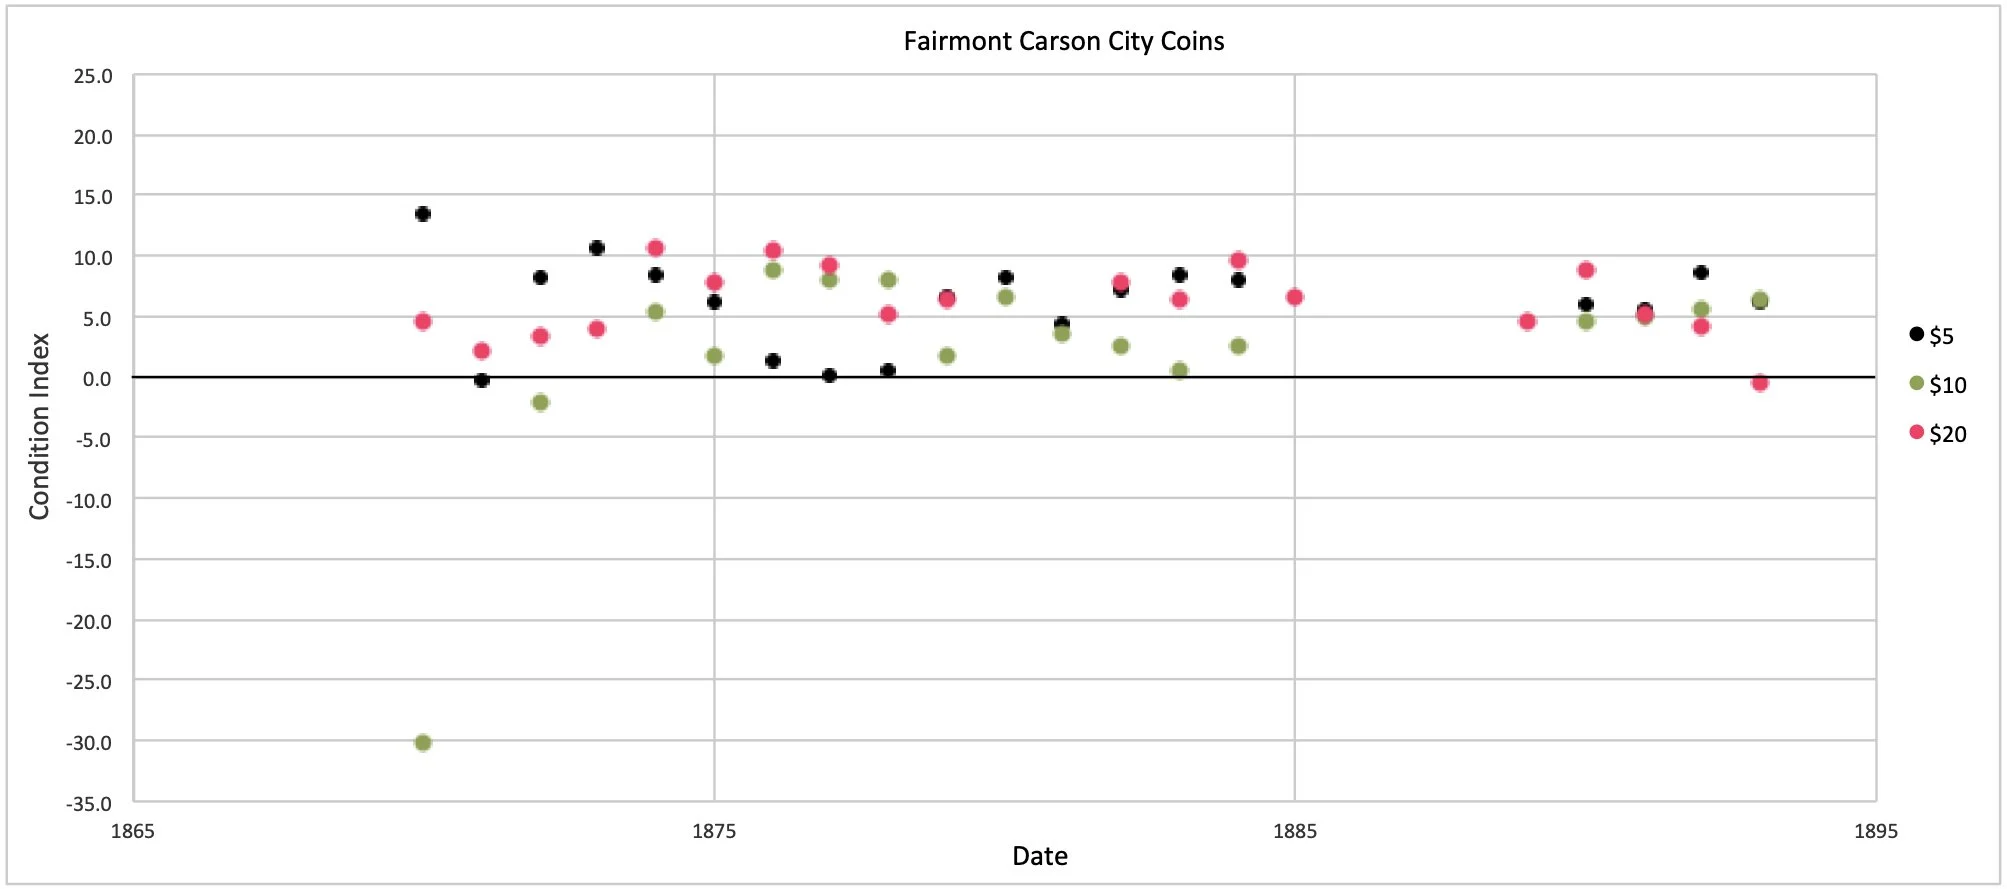
Clearly, the Condition Index tends to be positive, implying that the Fairmont Carson City coins are, on average, nicer than their PCGS counterparts. The question is whether this is a real distinction, or an artifact?
I suspect it is an artifact. Recall that my census numbers (the “Counts”) are mainly pedigreed coins. Accordingly, the grade distributions and the derived WAGs are almost certainly deceptively high, because the pedigreed Fairmonts are generally the finest available for each issue. Given the likely origin of the Fairmont hoard, it would, in fact, be rather surprising if its coins were, on average, significantly nicer, in terms of assigned grade, than their counterparts in the overall population of US gold coins. Rather, I think the offset in the Condition Index is likely to be a selection effect.
Analysis and Modeling - Survival Estimates
In previous articles in this series, I showed that mintage numbers, segregated according to mint and adjusted for attrition, work surprisingly well to model the number distribution of the no-motto half eagles in the Fairmont hoard (FGP #7), and discussed the use of both Third-Party-Grading (TPG) numbers (i.e., NGC & PCGS Pop Report data) and expert knowledge as a basis for survival estimates for the no-motto half eagles (FGP #8).
In this section, I will further develop those ideas to investigate how well (1) mintage numbers, adjusted for attrition, (2) TPG numbers, and (3) Rusty Goe’s survival estimates reproduce the observed distribution of the Carson City Fairmonts.
1. Mintage Numbers, Adjusted for Attrition
At first blush, the notion of using mintage numbers to estimate survival rates may seem absurd: everyone knows that the numbers of present-day survivors are but tiny fractions of the original mintages. For the Carson City $5s, $10s, and $20s, combined, the survivors are probably only 2-3% of the original issue.
However, even though the loss rates exceed 97%, mintage numbers still matter. Indeed, the single most important predictor for the number of Fairmont coins for any date/mint variety is mintage: high-mintage issues strongly tend to be represented by relatively numerous Fairmont coins, and low-mintage issues by fewer.
Even so, raw mintage numbers are not very good quantitative predictors for survival. One reason is attrition - as gold coins circulated, they became worn or damaged. Gold coins were legal-tender money, but only if they were full-weight, and worn coins are underweight. Such coins were, accordingly, removed from circulation, and their gold content was re-coined into current, full-weight coins. Older coins, being exposed longer to wear, were less likely to ultimately survive this removal process.
Besides wear-related attrition, there were several other ways gold coins left the domestic US circulating coin stock: some (indeed, ultimately most) were lost, hidden in hoards, exported, or recalled & melted.
In particular, it is well known that massive export of US gold coins to settle trade imbalances under the gold standard, or to arbitrage the mismatch between gold and silver bullion prices, started in the late 1870s. Significant fractions of the entire mintage for some issues of freshly-minted coins, especially $10s and $20s, were exported, and gold coins from Carson City were undoubted included in these exports. These exports skewed the remaining supply of gold coins in domestic circulation, from which the Fairmont hoard was probably drawn.
Bearing all this in mind, I have constructed a simple two-parameter model, using mintage and attrition over time as the independent variables, to represent the Fairmont data. I assumed that the number of survivors for each issue is proportional to the original mintage, and then removed that dependence from the data by multiplying the observed numbers of Fairmont coins (the “F-Total” values) for each variety by the quantity: (1,000,000 / mintage). This produces a parameter (pieces per million, or PPM) that equals the number of Fairmont coins that would exist for each variety if a million coins were minted for each, everything else being equal. This rescaling doesn’t really change anything - it just makes the numbers easier to deal with.
To model attrition, I adopted a specific attrition law known as exponential decay, which stipulates that a constant fraction of the surviving members of an initial population is lost during each successive time step (each year, for example). One well-known example of exponential decay found in nature is radioactive decay. Carbon-14 dating is an example of its use.
The figure below shows the dependence of the PPM parameter on issue date for the Carson City Fairmonts, along with the best-fit trend lines, which are the model outputs, one for each series. If the input data were complete and accurate, and perfectly represented by the model, the input points would all lie along the trend lines, and the trend lines would all coincide. The fact that they do not invites further discussion.
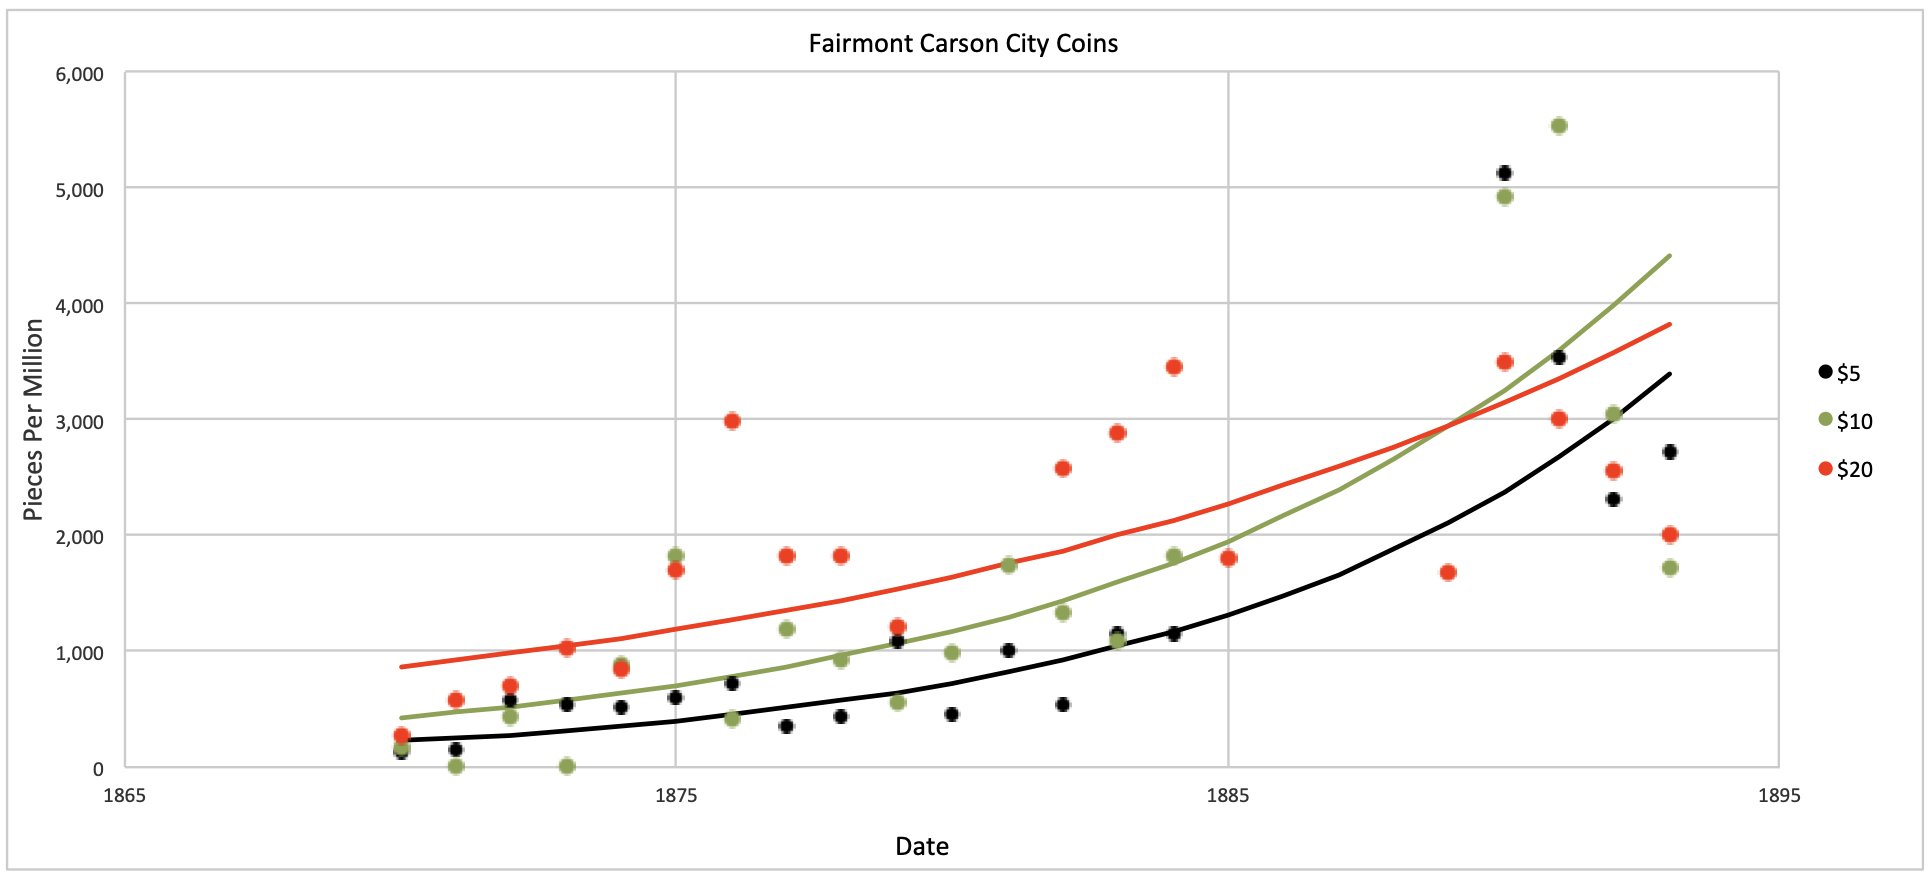
Visual inspection of the figure shows that the data points for three denominations intermix reasonably well, although there is a suggestion that the Carson City double eagles tend to lie toward the top of the distribution, and are therefore somewhat over-represented among Fairmont coins, relative to the half eagles and eagles. The fact that the best-fit trend lines all systematically rise towards later issue dates means that attrition is present, as expected. However, attrition cannot account for most of the scatter in the data, because it is a slowly-acting phenomenon. Some of the scatter among the data points no doubt arises from statistical variation, which is expected, although the effect of exports is probably also involved - the scatter among the data points for the double eagles is considerably more than for the half eagles, which, for the most part, were not as heavily exported.
1893-CC $10.00 PCGS AU58 CAC, ex Fairmont. From the DWN Archives.
2. Third-Party Grading (TPG) Numbers
The problem with using Third-Party Grading (TPG) numbers as survival estimators is that unrecognized re-submissions and submission bias distort the published populations.
A sense of the difficulties with TPG data may be had by noting that, as of late December, 2024, PCGS reported that it had graded a combined total of 33,508 half eagles, eagles, and double eagles from Carson City, and NGC reported grading 32,696, with another 8,468 receiving NGC-Details grades. PCGS does not report its details grades, but assuming a number comparable to NGC, the implied total is over 83,000 coins for the three series, about 1.8x the maximum number of likely survivors estimated by Rusty Goe in 2020 - around 38,500. Unrecognized re-submissions are evidently quite numerous among Carson City coins.
Besides unrecognized regrades, submission bias is also at work, in two ways. Briefly, it seems more likely that a run-of-the-mill gold coin from Carson City will be submitted to NGC or PCGS for grading than a similar, common-date coin from Philadelphia or San Francisco. It is also much more likely that a worn 1870-CC double eagle will be submitted to NGC or PCGS (perhaps multiple times) than a similar 1890-CC double eagle.
Bearing all this in mind, I have constructed a simple one-parameter model, using a combined TPG number derived from the NGC and PCGS Population Reports as of late December, 2024, as the independent variable to model the Fairmont data. The TPG number is simply the sum of the NGC & PCGS numerically-graded numbers plus twice the NGC-Details number - PCGS does not report its details grades, but I am assuming numbers comparable to NGC. For the actual model, I used the ratio of the Fairmont “F-Total” number and the “TPG number” for each issue, converted to a percentage.
The figure below shows the dependence of the Fairmont/TPG ratio on issue date for the Carson City Fairmonts, along with the best-fit trend lines, which are the model outputs, one for each series. Once again, if the input data were complete and accurate, and perfectly represented by the model, the input points would all lie along the trend lines, and the trend lines would all coincide. In addition, the trend lines would all be flat.
In fact, little of this is true. The pronounced upward slope of the trend lines for the half eagles and the eagles from left to right is caused largely by the issues from the 1890s that are greatly in excess in the Fairmont hoard, relative to expectations based on TPG numbers. In contrast, the double eagles are modeled reasonably well, except for a few outliers - the trend line is fairly flat.

Among the half eagles and the eagles, the late-date high-side outliers are common dates. Even for the double eagles, the high-side outliers are common dates: 1876-CC, 1884-CC, and 1890-CC. Accordingly, the figure suggest that the Carson City Fairmonts include unexpectedly large numbers of common-date coins, relative to the TPG numbers.
Part of this may be the effect of unrecognized re-submissions and submission bias in the TPG numbers: both result in a tendency to under-state the numbers for common-date coins, relative to scarce/rare dates.
3. Rusty Goe’s Survival Estimates
For this variation, I have constructed a simple one-parameter model, using the mid-points of the intervals Rusty published in 2020 as his survival estimates for Carson City coins as the independent variable to model the Fairmont data. For the actual model, I used the ratio of the Fairmont “F-Total” number and the “RG-Est” for each issue, again converted to a percentage, analogous to the TSP model.
The figure below shows the dependence of the Fairmont/RG-Est ratio on issue date for the New Orleans Fairmonts, along with the best-fit trend lines, which are the model outputs, one for each series. As with the TSP model, if the input data were complete and accurate, and perfectly represented by the model, the input points would all lie along the trend lines, the trend lines would all coincide, and they would all be flat.
Inspection quickly shows that the differences between this model and the TSP model are subtle. Once again, the pronounced upward slope of the trend lines for the half eagles and the eagles from left to right is caused largely by the common-date issues from the 1890s in the Fairmont hoard that are greatly in excess of expectation. In contrast, the double eagles are modeled reasonably well, although the prominent high-side outliers are, once again, common dates: 1876-CC & 1884-CC.
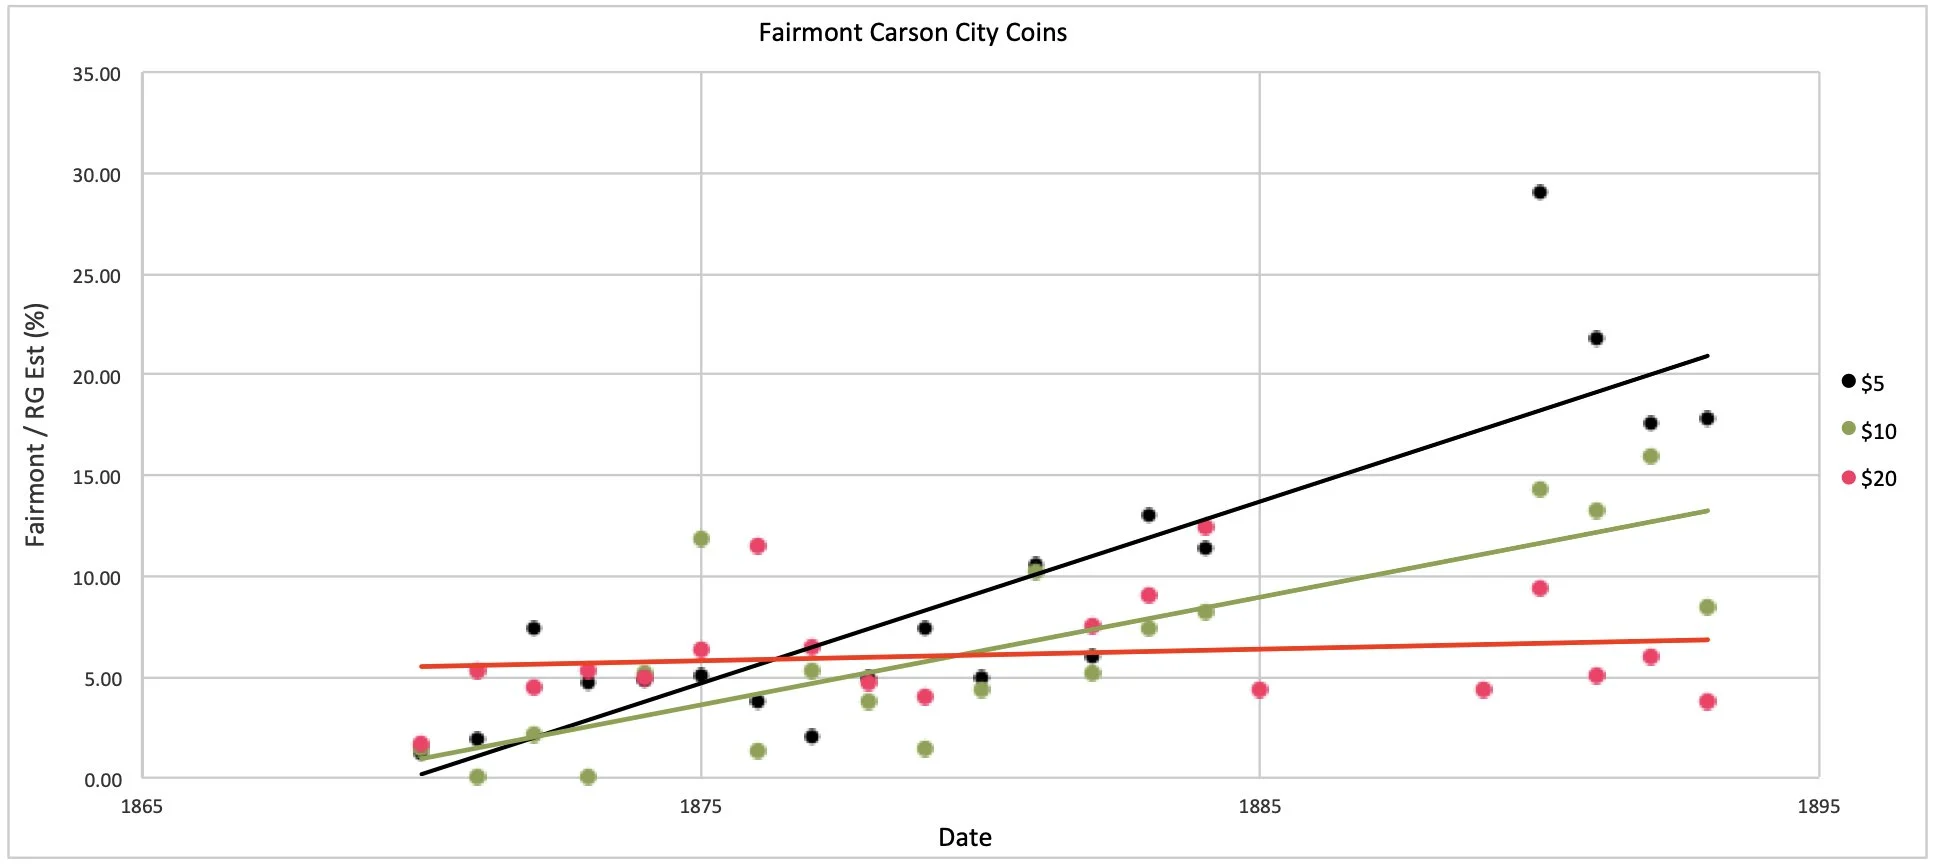
For the RG model, we cannot attribute the tendency to under-predict the common dates to unrecognized re-submissions and submission bias. Perhaps part of it reflects the very human tendency to depreciate the common-place. For example, everyone knows there are many more surviving 1891-CC half eagles than 1870-CC half eagles, but we probably don’t often bother to invest a lot of time trying to precisely quantify the excess, and end up making under-estimates for the common-date coins.
Another possibility is that the distribution of the Carson City Fairmonts is truly anomalous, relative to the non-Fairmont population that underlies both the TPG numbers and Rusty’s estimates. Perhaps the Fairmont hoard truly does include unexpectedly large numbers of common-date Carson City coins.
To quote what Brian Kendrella wrote in his preface to the February, 2025, Riviera Set sale (the final SBG Fairmont auction):
“… the Fairmont Collection was the largest accumulation of United States gold coins to ever come to market … Generations of numismatic scholarship have been altered, and these sales have forced the revision of survival estimates for many different dates, especially among branch mint Liberty Head gold coins.”
The foregoing analysis may perhaps be considered part of that revision.
4. Summary
For each issue, it is possible to calculate the number of Fairmont coins predicted by a model - among analysts, this is called the “expected” value. A widely-used criterion for assessing goodness-of-fit is the so-called chi-square () statistic, defined as

where O is the observed (i.e., input) value, and E is the expected (i.e., model) value for each issue. The individual chi-square numbers are then summed to produce the overall statistic for the entire series. Without going into greater detail, I will simply remark that the smaller the chi-square statistic is, the better the fit - for a perfect fit, the observed values would all equal the expected values, and the chi-square statistic would have a value of zero, for each issue as well as for the entire series.
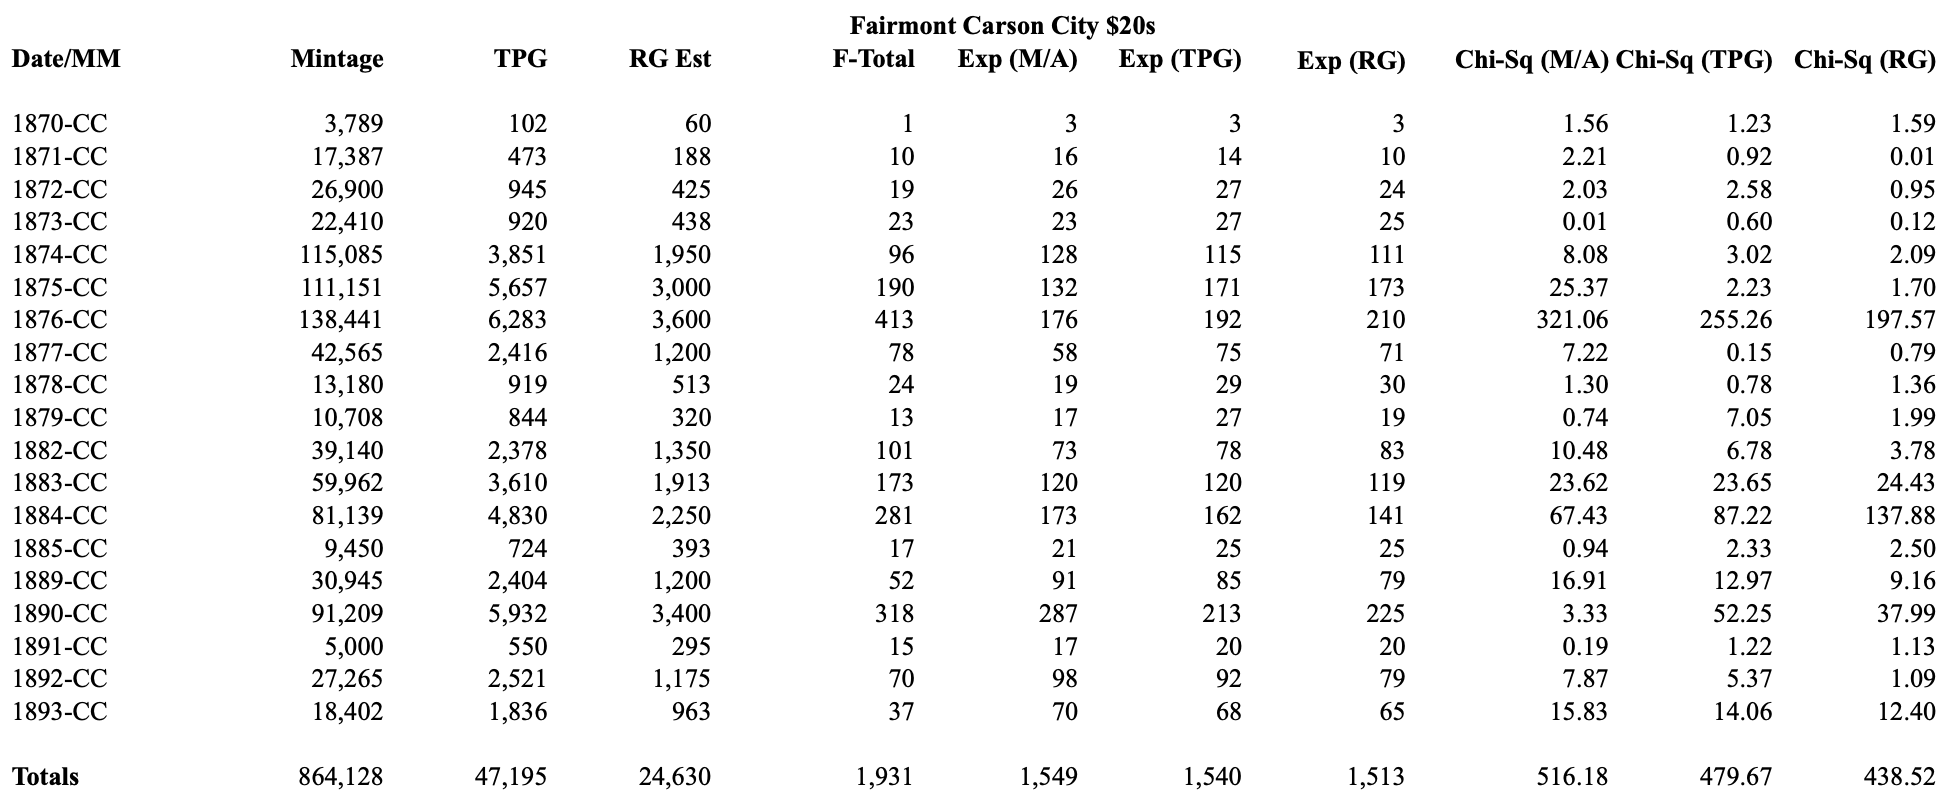
The following table summarizes all this, issue-by issue. The expectation values derived from the three models have been rounded to whole numbers - listing fractional coins seems a bit odd, to me - but the chi-square numbers were calculated using the un-rounded numbers, so there may be some minor inconsistencies in the tabulated data. Large values for the chi-square statistic indicate varieties where a particular model had difficulty matching the observed values.
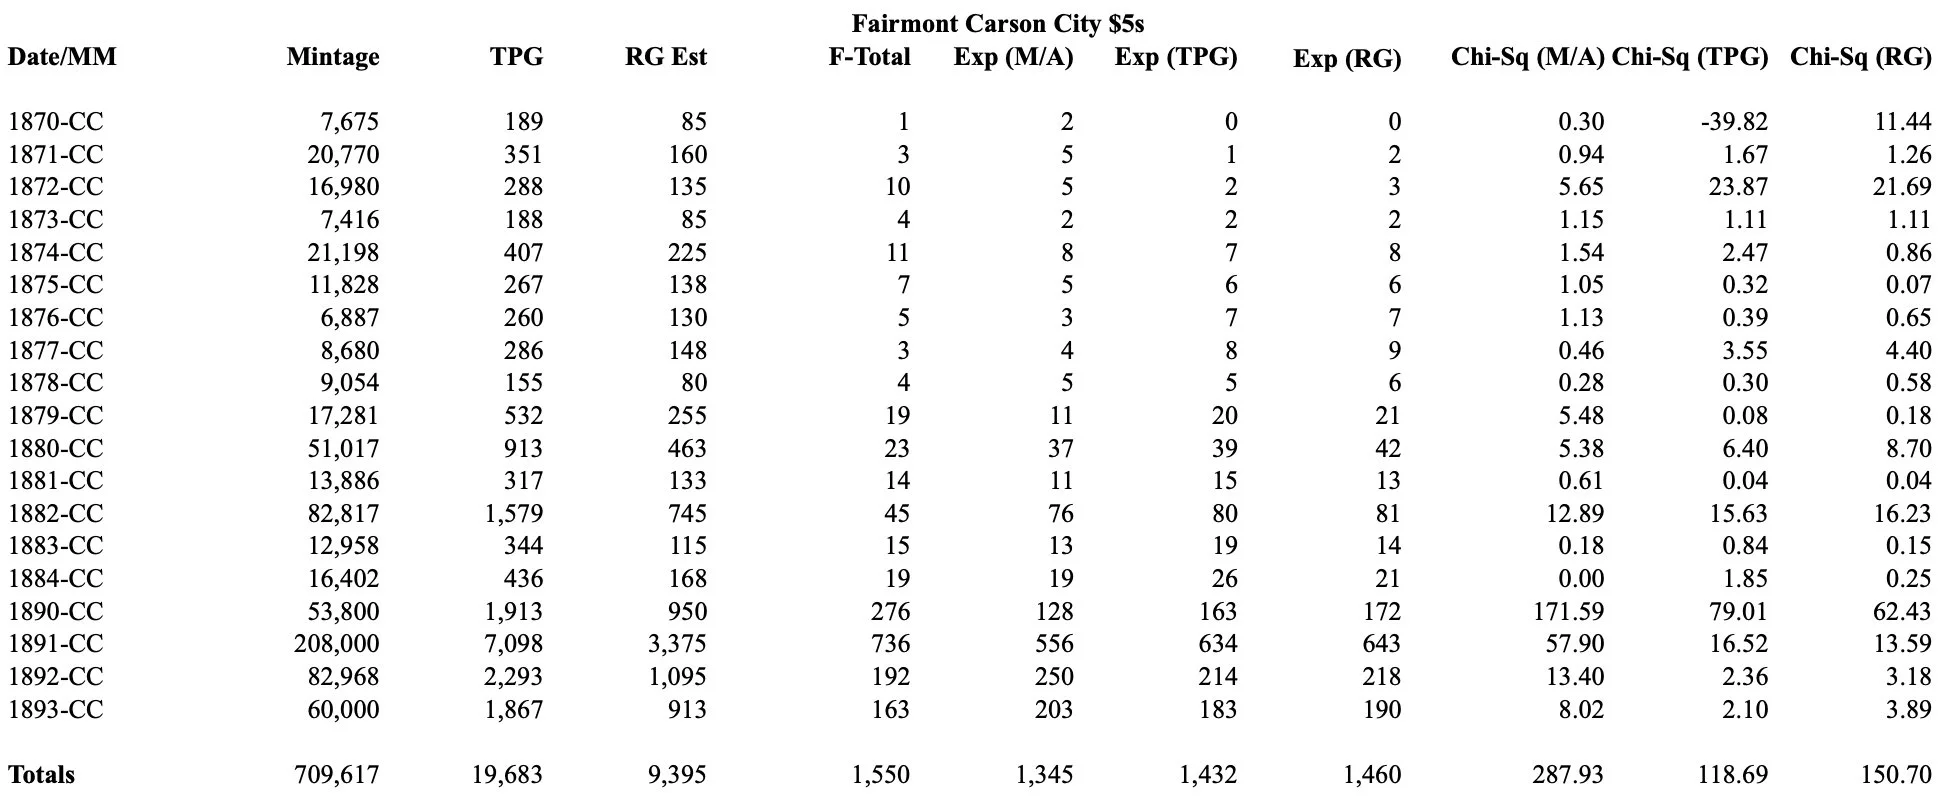

Among Among the half eagles, the stand-out problem according to chi-square is the 1890-CC - all three models badly under-estimate the observed number. The 1891-CC has the same problem. Both the TPG model and the RG model also under-estimate 1872-CC, but we are dealing with small numbers in this case. The chi-square for the 1870-CC issue is negative for the TPG model, but this is not a typo - the predicted number of coins is essentially zero, but slightly negative. For this reason, the large negative chi-square is not of much concern in this particular instance.
Among the eagles, the stand-out problem for the M/A model and the TPG model is the 1891-CC - both under-predict. In comparison, Rusty nailed this one.
Among the double eagles, the stand-out problem is the 1876-CC - all three models badly under-estimate the observed number. The runner-up is the 1884-CC, with the same problem.
There are also a few cases where the models over-estimate the observed number: the 1880-CC & 1882-CC half eagles, the 1893-CC eagle, and the 1889-CC & 1893-CC double eagles catch my eye in this respect.
A curious reader can undoubtedly spot other problem issues of interest.
Overall, there seems to be a pronounced tendency for the models to under-estimate common dates, and I think this is perhaps the main take-away from this exercise. As Doug remarked to me some time ago, the lesson from Fairmont seems to be that issues we thought were rare are, in fact, rare, and issues we thought were common are, in fact, even more plentiful than we thought.
Readers hoping that I would declare a “winner” among the three models will be disappointed. The task for each model was to match as closely as possible the observed distribution of the Fairmont Carson City coins, with all its quirks. Among these quirks is the fact that the Fairmont hoard is likely a sample of the population of US gold coins that circulated in 1932 or, perhaps more accurately, resided in US bank vaults at that time. The hoard probably does not provide a particularly accurate snapshot of the present-day population, which includes massive numbers of repatriated coins (including, of course, the Fairmont coins).

1875-CC $20.00 PCGS MS61, ex Fairmont. From the DWN Archives.
That said, the summary scorecard is shown below. I think the surprise may be that the TPG model did almost as well, overall, as the RG model. The TPG numbers clearly have value, when used appropriately: they are not a direct indicator of survival, but evidently reflect the relative numbers reasonably well.

Summary and Discussion
The Fairmont hoard is enormous, and contains over 4,400 of Carson City coins - by my current reckoning, 1,550 half eagles, 942 eagles, and 1,931 double eagles. Most of these Carson City coins are concentrated in relatively few issues. For the half eagles, the four issues from the 1890s together comprise 1,367 coins (i.e., over 88% of the total); for the eagles, the 1890-CC and 1891-CC issues together comprise 697 examples (i.e., 74%); and for the double eagles, the three most numerous issues, 1876-CC, 1884-CC, and 1890-CC together comprise 1,012 coins (i.e., over 52%).
As of late December, 2024, PCGS reports that it had graded a combined total of 33,508 half eagles, eagles, and double eagles from Carson City, and NGC reported grading 32,696, with another 8,468 receiving NGC-Details grades. PCGS does not report its details grades, but assuming a number comparable to NGC, the implied total is over 83,000 coins for the three series. The 4,400+ Carson City Fairmonts represent about 5.3% of this number - allowing for multiple counts, a better number is perhaps about 3% of the actual total - and I believe that most of these coins remain unsold at present. What effect this supply overhang may have on future prices is anyone’s guess, but it is unlikely to be positive, particularly for the common dates.
The single 1870-CC eagle among the Fairmonts that graded PCGS G-6 stands out like the proverbial sore thumb. It seems inconceivable that the only Carson City coin in the Fairmont hoard with a grade this low would also be a leading rarity - rather, I suspect, the only 1870-CC eagle in the Fairmont hoard also happened to be a low-grade coin. Surely, if there is one low-grade 1870-CC Fairmont eagle, there must also be dozens, or even hundreds, of similarly low-grade Carson City Fairmonts for the more common issues. Where are they?
My guess is that these coins do, indeed, exist, but they are among what I have called the “ungraded” Fairmonts - coins that have never been submitted to PCGS for grading, presumably because they are badly worn or damaged.
At various places in this series of articles, I have speculated that these ungraded Fairmonts number perhaps 5% - 10% of the coins in the hoard, which for Carson City, would mean perhaps a few hundred coins.
However, I tend to discount stories that large numbers of badly worn and/or damaged Fairmont coins have been culled and (perhaps) melted. The reason is that, if anything, the Fairmont hoard, even as known, seems to be characterized by too few examples of rarities, and this would be exacerbated by wholesale culling. This tendency is present among the Carson City Fairmonts: inspection of the survival table above shows, for example, that the three models consistently predict that there should have been examples of both the 1871-CC & 1873-CC eagles among the Fairmont coins, but there were none.
It is not hard to find other examples.
President Biden often concluded his speeches, on whatever subject, with the same words: “And God bless our troops.” In that spirit, I will conclude this article with my customary ending: I wish we had the actual inventory data for the Fairmont hoard.