Fairmont Gold Pieces, Part VII: An Attrition Model for the Fairmont No Motto Half Eagles
/A guest blog by Richard Raddick
Introduction
In a previous article I described a procedure for estimating the number of Fairmont coins directly from time series constructed from historical records of the PCGS Population Report (Pop Report) database. These time series track the cumulative counts of US gold coins graded by PCGS for every date/mint variety, starting in late 2017 and ending at the current time, with a two-month cadence.
The main goal of the previous article was to validate the estimation procedure using my database for the Fairmont no-motto half eagles as “ground truth.” This comparison indicated that the procedure works quite well, especially for varieties where several dozen or more coins were involved, for which the times series estimates match the actual counts of Fairmont no-motto half eagles (“NM $5s) with to within a few percent. Even for smaller numbers of coins, the match was not too bad.
Thus, the estimation procedure has the ability to accurately estimate the numbers for the more common varieties of gold coins in the Fairmont hoard, for which my actual counts, which typically include only what I call the “Pedigreed Fairmonts,” are often incomplete. Some of these more common varieties are represented by hundreds, or even thousands, of coins in the Fairmont hoard, and the number of Pedigreed Fairmonts among them is typically fewer than 30 coins. For the scarcer varieties, I believe my actual counts are generally complete, implying that I already have reliable numbers for these issues. The dividing line seems to be about 20 known examples.
In this article, I will put the estimation procedure to work providing input data for an attrition model for the Fairmont NM half eagles. For these particular coins, I could have used the actual counts, which I believe are more-or-less complete. However, my ultimate goal is to apply the attrition model to other groups of Fairmont coins (the Carson City $20s, for example), for which accurate counts do not exist. Accordingly, my purpose here is to further refine the estimation procedure, and develop a protocol for using it, along with whatever counts happen to exist, to select input data for the attrition model.
The next section of this article will focus on the data selection process. I will then describe the attrition model itself, followed by the results.
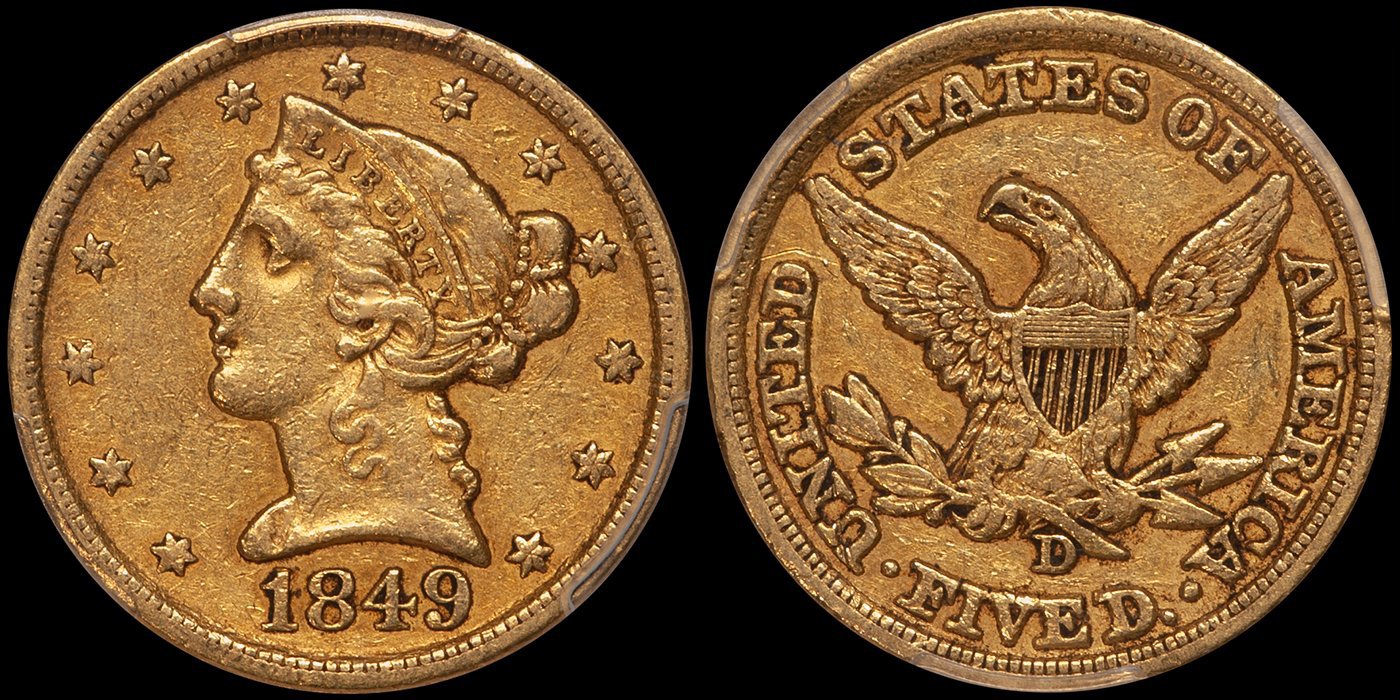
1849-D $5.00 PCGS EF40 CAC, ex Fairmont; DWN archives
Data Selection and Rescaling
Even the best model will not perform well when it is driven by inaccurate or biased input data. Among analysts, this is sometimes called the “garbage in, garbage out” or “GIGO” principle. Effort invested in data quality control helps avoid GIGO.
According to the PCGS taxonomy, there are 121 varieties of NM $5 half eagles, including the “zombie” 1853-D (Medium D) variety that is no longer recognized by PCGS in its Coin Facts, but does appear in the PCGS Population Reports as ten coins. Doug believes this variety does not actually exist. My NM $5 database counts 3,419 Fairmont half eagles, distributed among these 121 varieties, ranging from six varieties with no coins, to the 1861-P with 750. I have constructed time series for all these varieties.
For each Fairmont NM $5 variety, I have two numbers: an actual count (which I will designate “CTot”), and an estimate derived from the time series (which I will designate “TTot”). Thus, the desired quantity, the number of coins likely to be in the Fairmont hoard (which I will designate “FTot”), will be either CTot or TTot - the trick is to decide which.
Logically, the selection process I developed is a three-step decision process, which can be described in semi-mathematical terms as:
(i.e., choose the actual count if it is likely to be complete, which it plausibly is when it is larger than the time series estimate).
(i.e., this is probably a “scarce” variety, for which the actual count is likely to be complete).
In developing this decision process, I found evidence that the time series analysis procedure itself could be improved by allowing it to use the central two-thirds of the ordered difference series, rather than only the central half (which I used previously), to estimate the non-Fairmont background. The time series are significantly longer now than they were two or three years ago, when I first developed the procedure, and the change takes advantage of this fact. This is a change from the previous article.
Several pairs of the 121 PCGS half eagle varieties, such the 1834 (Plain 4) and the 1834 (Crosslet 4), do not have known individual mintages. For these pairs, I apportioned the combine mintage according to the ratio of coins PCGS has graded: for the two 1834 half eagle varieties, PCGS has graded 1,928 and 122 examples, as of late October 2024, which implies an apportionment of 618,333 and 39,127 coins from the combined mintage of 657,460 coins.
For purpose of modeling, mintage is a rather inconvenient parameter because of its large range. For the NM $5s, this range is from 268 (1854-S) to 877,741 (1847). A further inconvenience is the fact that the mintages are typically 1,000 to 10,000 times larger than the Fairmont numbers.
One way to alleviate these troublesome circumstances is to multiply the observed numbers of Fairmont coins for each variety by the quantity: (1,000,000 / mintage). This rescaling produces a parameter (pieces per million, or PPM) that equals the number of Fairmont coins that would exist for each variety if a million coins were minted for each, everything else being equal. This rescaling doesn’t really change anything - it just makes the numbers easier to deal with.
Mathematically, the rescaling procedure may be represented as:
In effect, I am constructing an alternate universe in which every variety of NM half eagle was minted in the number of 1,000,000 pieces, and PPM of these ended up in the Fairmont hoard. For the NM $5s, PPM is always in the range from zero to 2,000, and typically has a value of a few hundred.
A few examples may help illustrate all this.
In the following table, I have listed data for five varieties of NM half eagles. “Hard” - i.e., known - quantities are highlighted in green, and inferred quantities are highlighted in yellow. Any calculated quantity that uses an inferred quantity as input is itself deemed to be inferred.
There were also two instances where the time series total had been chosen and it also disagreed by more than 50% from the actual count: the 1846-P (Small Date) and the 1847-P (Misplaced Date) varieties. These could be red flags.
The Attrition Model
The single most important predictor for the total number of Fairmont NM half eagles for any date/mint variety is mintage: high-mintage issues strongly tend to be represented by relatively numerous Fairmont coins, and low-mintage issues by fewer.
For example, there are 23 varieties of NM half eagles that have mintages of 100,000 coins or more, and the smallest number of examples for any of these among the Fairmont coins is nine (the 1837 Classic). Six of the 23 high-mintage varieties are represented by over 100 Fairmont examples, up to 750 for the 1861-P. Only one additional variety outside these 23, the 1857-P, with a mintage 98,188 (i.e., almost 100,000), exceeds the century mark.
At the other extreme, there are 20 varieties of NM half eagles with known or inferred mintages of 10,000 coins or less, and for these low-mintage varieties, the largest number of known examples among the Fairmont coins is five. Five varieties have none at all, and three more are represented by single examples.
The second most important predictor is date-of-issue. This becomes clear when the dependance on mintage is removed from the data by rescaling the numbers to the PPM parameter: older coins generally have smaller values for PPM than do newer coins.
The reason date-of-issue matters is attrition - as gold coins circulated, they became worn or damaged. Gold coins were legal-tender money, but only if they were full-weight, and a worn coin is underweight. Such coins were, accordingly, removed from circulation, and their gold content was re-coined into current, full-weight coins. Older coins, being exposed longer to wear, were less likely to ultimately survive this removal process.
Besides wear-related removal, there were several other ways gold coins left the domestic US circulating coin stock: some (indeed, ultimately most) were lost, hidden in hoards, exported, or melted. Although these could perhaps also be considered attrition, the term attrition most strongly suggests the gradual age-dependent loss through wear, and I will use it in this sense.
With these considerations in mind, I have constructed a simple two-parameter attrition model, using mintage and attrition over time as independent variables, to model the Fairmont data. I adopted a specific attrition law known as exponential decay, which assumes that a constant fraction of the surviving members of a population be lost during each successive time step (each year, for example), for my model. One well-known example of exponential decay found in nature is radioactive decay. Carbon-14 dating is an example of its use.
With these preliminaries concluded, it’s time to look at some results.
1854 $5.00 PCGS MS61 CAC, ex Fairmont; DWN archives
Results and Discussion
The first figure below shows the dependence of the PPM parameter on issue date (i.e., the model input, plotted as points) for the Philadelphia Fairmont NM half eagles, along with the best-fit model to the input data (i.e., the attrition model output - the solid line). If the PPM numbers were completely accurate, and the data were perfectly represented by the model, the input points would all lie along the model trendline. Because of statistical variation, they are, instead, scattered about it.
The fact that the model appears to be a fairly good representation of the data implies that exponential decay attrition is a reasonable choice for the Philadelphia NM half eagles. The difference between the PPM for a point on the right side of the diagram, such as 1863, and one on the left, such as 1836, is due to age, and age alone: older coins suffered greater attrition.
The best-fit curve permits the fraction of the remaining coins lost to attrition every successive year to be calculated. For the Philadelphia NM half eagles, it was about 9.3%.
The next diagram shows the same information for the three Southern mints, Charlotte, Dahlonega, and New Orleans, plotted on the same scale as the Philadelphia figure. Grouping the three together saves space, of course, but it also serves to emphasize the similarities among the three Southern mints, not only in terms of their total NM half eagle mintages, which is well-known, but also in the attrition these coins experienced.
Following is the diagram for San Francisco, also plotted on the same scale. San Francisco is the odd-ball. Its half eagles are notably deficient among the Fairmont coins, relative to the other four mints, and their attrition pattern is also quite different, showing only a weak dependence on age.
The final diagram overlays the information for all five mints. It is, admittedly, a busy plot, but it indicates some interesting patterns among the five groups of NM half eagles.
(1) The attrition curve for the Philadelphia coins is on top, certainly for the varieties issued after about 1850. The attrition rate for the Philadelphia NM half eagles was also the largest - the Philadelphia trendline is the steepest. This is perhaps a bit of a surprise.
(2) The San Francisco group differs noticeably from the other four. Some of this could be an artifact of the pronounced scarcity of 1860 to 1866 San Francisco half eagles among the Fairmont coins. Among these seven issues, the 1865-S has 10 known examples, and the remaining six issues, together, contribute only 14 more. The 1863-S is represented by a single coin. If there were two, its PPM would double, moving its point up considerably in the diagrams. In other words, just a few additional San Francisco half eagles from the 1860s would tilt the right end of its model trendline up enough to more-or-less match the other four.
(3) However, the left end of the San Francisco trendline is quite firmly anchored by the relatively abundant issues from 1855, 1856, and 1857. Thus, regardless of what might happen to its right end, the model trendline would remain noticeably below the others: San Francisco NM half eagles are truly deficient among the Fairmont coins.
(4) There may be a simple explanation for all this. If the Fairmont hoard originated in the Northeast, perhaps from a New York bank in 1932 or 1933, then its coins would presumably favor those from Philadelphia over those from the Southern mints, and even more so over those from San Francisco.
(5) As mentioned previously, the model trendline measures the fraction of the coins lost to attrition every year. The following table presents the annual attrition rates for all five mints, plus the combined rate, which is quite strongly affected by the anomalous San Francisco group.
The following appendix contains summary data for all 121 issues of no-motto half eagles, organized by mint. The color coding is from the data selection process, as described above.
For each issue, the number of Fairmont coins predicted by the model as its output, and the difference (Observed - Expected), or (FTot - Model) - i.e., what analysts call the residual - are listed. For each mint, the model has been constrained to predict the same total number of coins as the observed total - for Philadelphia, 2,888 coins; for Charlotte, 285; for Dahlonega, 280: for New Orleans, 124; and for San Francisco, 81. Thus, positive residuals indicate varieties that are over-represented among the Fairmont NM half eagles, relative to the attrition model, and negative residuals indicate under-represented varieties. In terms of numbers, the 1851-P is the most under-represented, and the 1861-P is the most over-represented. Perhaps more interesting is the fact that the 1852-D appears to be significantly under-represented.
The six issues that are unknown among the Fairmont coins - 1840-D (Small D), 1841-D (Tall D), 1847-O, the zombie issue 1853-D (Medium D), 1854-S, and 1859-D (Large D) - are included in the tables, because the model produces estimates for their expected numbers in the Fairmont hoard. In particular, the model suggests there should have been one 1841-D (Tall D), and two 1847-O NM half eagles, among the Fairmont coins. The absence of
1847-O half eagles among the Fairmont coins is an enduring mystery.
I will end this article with my customary closing remark: It would be wonderful if we had definitive numbers characterizing the Fairmont hoard. This, however, would require a decision by the Fairmont managers to release their inventory data, which they almost certainly have, but have chosen to keep private. In its absence, I will continue to work with what I have, despite its flaws.
1857-O $5.00 PCGS EF45, ex Fairmont; DWN archives
Appendix: Data Tables for Individual Varieties of No Motto Half Eagles

