Fairmont Gold Pieces, Part IV: "Fairmonted"?
/
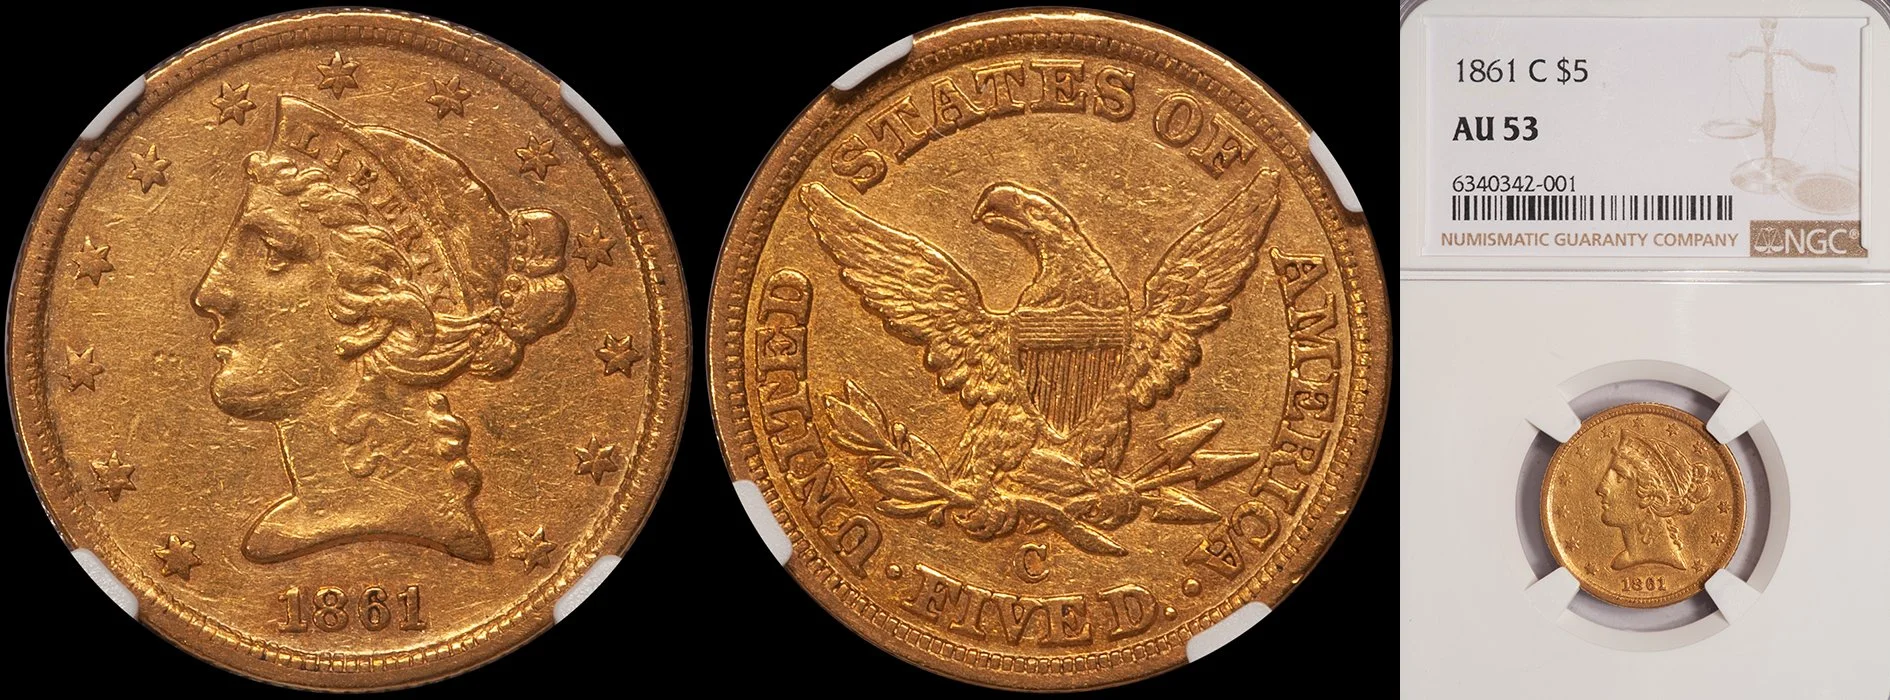
an 1859-O $20.00 in AU53 from the Fairmont Collection, sold later by DWN
a guest blog by Richard Radick
Introduction
About two months ago, after reading a draft for one of my blog pieces, Doug suggested: “How about writing one on which Type 1 $20s were most heavily Fairmonted?” - something I had not thought much about.
“Fairmonted”? Doug coined the term (I couldn’t resist…) a few years ago to describe what happened to gold coin prices in response to the seemingly never-ending flood of new supply from the Fairmont hoard. In particular, he argued that prices for some of the Type 1 $20s and, as I recall, some of the Carson City double eagles had been “Fairmonted” - pushed sharply downward - because of worries about the size and makeup of the Fairmont hoard.
Anyone who has taken the introductory course in economics was taught that prices depend on the interaction between supply and demand. Anyone who has taken the second course in economics knows that it’s not quite that simple: prices in imperfect markets (basically, all of them) react adversely in response to a host of influences besides simply supply and demand, including anticipated changes in supply or demand, uncertainty, apprehension, panic… It always seemed to me, reading Doug’s remarks about “Fairmonting,” that one of his aims was to calm the jitters of nervous customers and collectors facing an uncertain situation: was Fairmont a real or imagined threat? Perhaps a bit of both, he said. However, it also could represent the opportunity of a lifetime.
Approach and Analysis
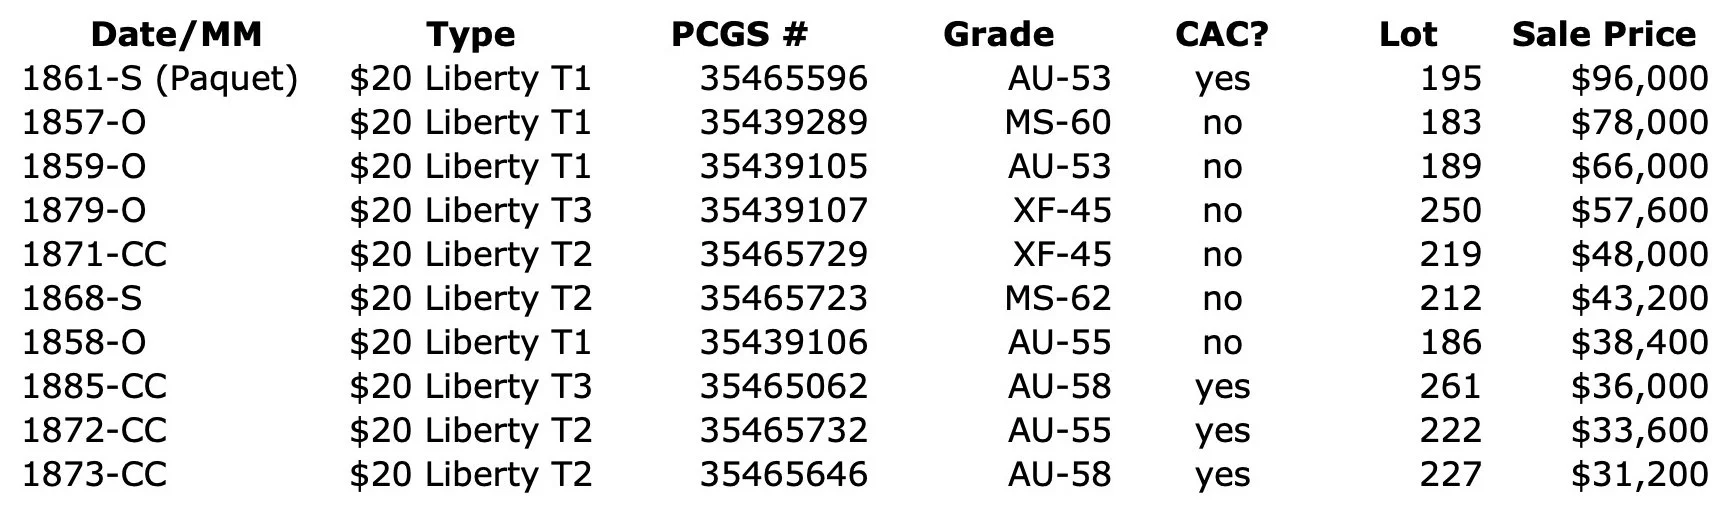
The first sale of Fairmont double eagles was also the first Fairmont sale, in June, 2018. It was essentially a date-set of Liberty Head $20s, although it lacked a number of the outstanding rarities, such as 1854-O, 1856-O, 1861 Paquet reverse, etc. The table below lists the ten top lots from that sale, in descending order of sale price.
Following this sale were some ten further Stack’s Bowers (SBG) auctions that included Fairmont double eagles. Unlike the first sale, however, these were not Fairmont-only sessions; rather, gaps in the Fairmont sequence were filled with non-Fairmont coins. The number of Fairmont double eagles offered in these sales declined steadily, and by the last one, in November, 2020, there were only three.
And then, nothing. Until the Hendricks sale in April, 2022, there were no further first-time sales of double eagles from the Fairmont Collection in the SBG auctions.
The figure below shows the PCGS Price History since early 2018 for the Liberty Head $20 Type 1 (No Motto) AU-55 type coin. Its most prominent feature is the pronounced trough, of over 25%, that started in early 2019 and ended about three years later, in early 2022. It was this price collapse that caught Doug’s eye, and which he attributed to Fairmont. The corresponding chart for XF45 is choppier, but shows the same trough. In contrast, the chart for MS63 is flat from 2018 through mid-2021, when it starts to rise, at first slowly, and then, recently, more rapidly.
In contrast with the T1 $20s, the corresponding AU55 Price Histories for the other contemporary gold coin types either show the trough less prominently (No Motto half eagles and eagles), or not at all (gold dollars & quarter eagles).

There are, however, some complications. One might suppose that the PCGS Price History chart for the T1 $20 type coin would be some sort of composite, representative of the entire series, but that would be incorrect: it is, rather, the price history for a single issue, the 1857-S. The chart shown above is, in fact, an overlay of the two Price Histories, the T1 $20 Type and the 1857-S, and they coincide exactly. Incidentally, the Price History charts that PCGS offers for the other two $20 Liberty Head types are also, in fact, single-issue charts: the 1873 Open-3 for T2, and (no surprise) the 1904 for T3.
The 1857-S issue is, of course, the most numerous among the T1 $20s, thanks to the coins from the S.S. Central America treasure, but it is not exactly typical of the series, because it is a composite - its mint-state coins are overwhelmingly the “salt water Uncs” from the S.S. Central America, and its lower grades are everything else.
Accordingly, the 1857-S may not be the best issue to use as a reference example for studying “Fairmonting.” In particular, the fact that the MS63 Price History for the “T1 $20 Type” - i.e., the 1857-S - has no 2019-2021 trough may simply mean that the price of its thousands of uncirculated coins from the S.S. Central America did not respond much to the few additional uncirculated T1 $20 Fairmont coins.
In fact, this seems to be the case. The PCGS Price History for the 1852 $20, another common date in the T1 $20 series, shows the expected trough for its MS63 coins. However, the trough is still most pronounced for the AU55 grade.

With these (rather lengthy) preliminaries now finally out of the way, I will describe the analysis procedure that I used to respond to Doug’s request.
(1) To simplify things, I decided to limit my analysis to AU-55 coins. This seems to be a reasonable choice - most of the T1 $20s in the pre-Hendricks Fairmont sales were upper-end AUs, and the effect that Doug is interested in seems to appear most strongly in the upper AU grades, also.
(2) Rather than use any particular issue as a reference (or the “T1 $20 Type” that is, in fact, the 1857-S issue), I decided to use an internal reference for each issue, as follows: for each issue, I selected three prices (1) one from early 2018, i.e., from before the first Fairmont sale; (2) the price at the bottom of the trough, or, in any case, the lowest price between mid-2019 and mid-2021; and (3) the highest recent price. For the “T1 $20 Type” coin (i.e., 1857-S), these three prices were $3,400, $2,450, and $3,700. They are indicated by the three arrows shown on the first plot.
(3) I then used these numbers to calculate two metrics: (1) the depth of the trough - for the 1857-S issue, 2,450/3,400 - 1 = -28%, and (2) the post-trough recovery - for the 1857-S, 3,700/3,400 = 109%.
(4) I decided to include the T2 $20s and the T3 $20s in the analysis, although AU-55 is probably not a particularly appropriate grade for analyzing the T3s, given the enormous numbers of mint-state coins that are available for many of the common-date T3 $20 issues. It is, however, appropriate for the Carson City issues, which I particularly wanted to look at.
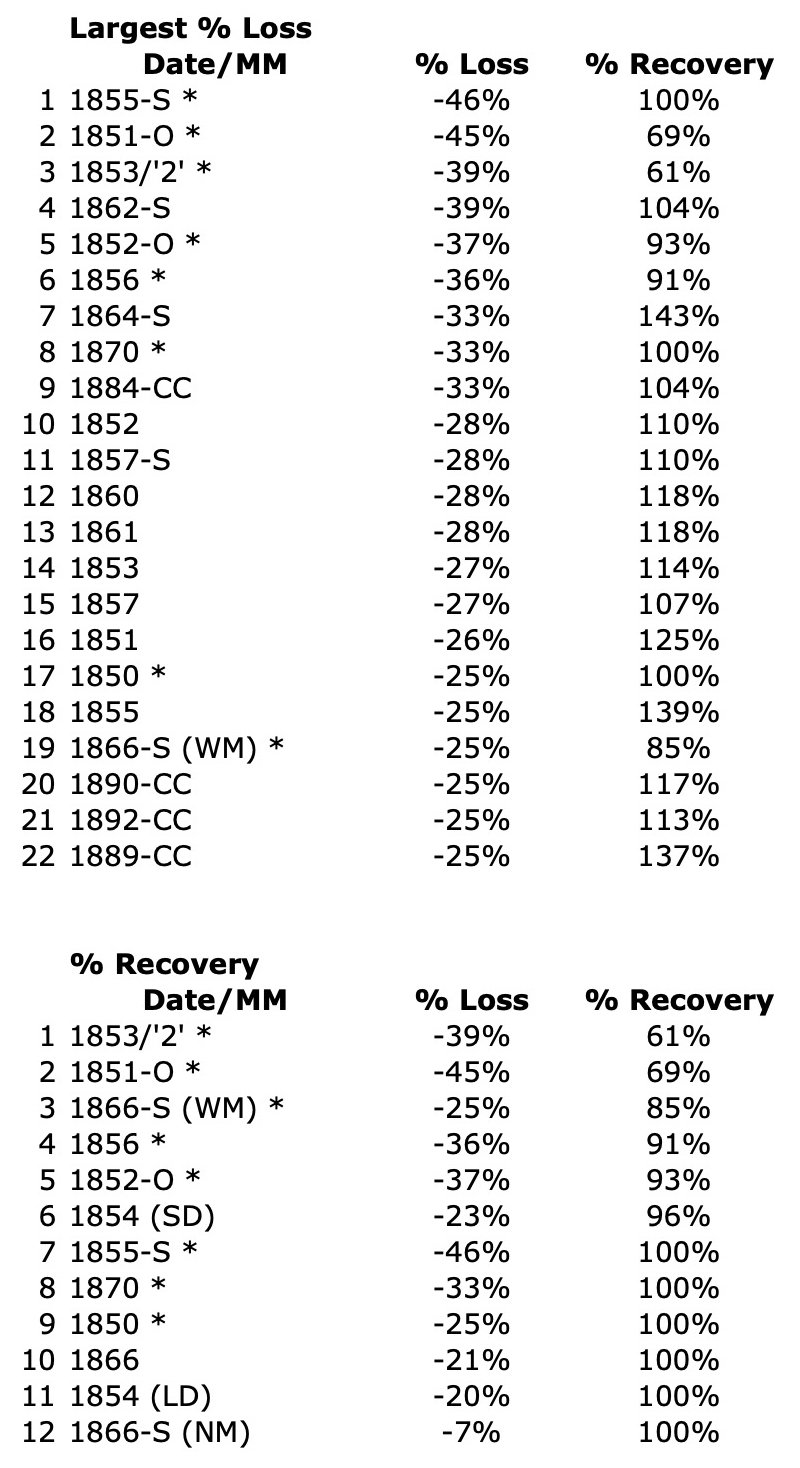
The results are shown below, as a two-part table. The upper part is a ranked list of the biggest losers, in order of decreasing trough depth. The lower part is another ranked list of losers, this one ordered by post-trough recovery.
Eight two-time losers - issues that appear on both lists - are marked with asterisks. These issues both lost a significant part of their value during the 2019-2021 downturn, and have since failed to recover their former price, or, at beat, have achieved break-even.
These eight issues constitute my response to Doug’s request.
Discussion
Considered as a whole, the biggest losers among the entire Liberty Head $20 series were neither the rarities nor the common dates - they were the issues in between, i.e., the better dates, but not the best dates. These include several of the T1 $20s and the relatively more common Carson City issues. These scarce-but-not-rare issues were the ones that were most heavily “Fairmonted.”
For the most part, the prices for the rarities did not respond at all to the appearance of the double eagles from the Fairmont Collection. This is, perhaps, no surprise, as it quickly became evident that there were few, if any, of the important rarities among the Fairmont double eagles - for example, there were no 1854-O, 1856-O, or 1861 Paquet reverse coins.
Like the rarities, the common dates (mainly T3 $20s, and a few of the T2 issues) did not respond to Fairmont, for a very obvious reason: the appearance of several nice, but not outstanding (condition-wise) Fairmont double eagles for these common dates had little impact on the market for these coins, which already had literally thousands upon thousands of nice, mint-state coins available.
Among the individual two-time losers, two issues from near the top of the list deserve separate comment: the 1853/’2’ and the 1851-O.
The price history since 2018 for the 1853/’2’ issue looks quite unlike all the others, and I believe this may be a reflection of its questionable status as a genuine overdate, rather than anything to do with “Fairmonting.”
As of this past November, the 1851-O may, in fact, be off the two-time loser list. The representative for this date in SBG’s Fairmont Kronen Set sale was a splendid AU-55 (CAC) example that simply smashed the existing sales record. PCGS evidently has yet (as of January, 2024) to adjust its Price Guide numbers for the results of the Kronen sale, and I rather expect the price for the AU-55 1851-O double eagle will shoot upward when this happens.
Eventually, presumably all the two-time losers (except, perhaps, the 1853/’2’) will make their way off the list, and this study of “Fairmonting” will fade into history.
Except, perhaps, the story is not quite yet over. There are, I believe, literally hundreds of thousands of non-pedigreed Fairmonts that remain unsold, and constitute a significant supply overhang for certain segments and issues of the gold coin market. At least two of these issues are listed in the table above - the 1884-CC and 1890-CC double eagles. I estimate that there are about 300 examples of each of these, and over 1,800 Carson City double eagles in total, from the Fairmont hoard that have been graded but remain largely unsold at the present time. Eventually this supply will enter the market.
There are, undoubtedly, other such examples. We may not be done, quite yet, with “Fairmonting.”